25/04/2025- 16/05/2025 (week 1 - week 14)
Bachelor of Design (Honours)
in Creative Media
Liang Lina 0347076
Information Design
- Exercise 1 & 2
INSTRUCTIONS
LECTURES
Week 2 / Introduction & Type of Infographics
In the second week, Mr. Fauzi gave us a summary of Exercise 1 and also
explained eight types of information charts, including:
- List infographics
- Statistical infographics
- How-to infographics
- Timeline infographics
- Comparison infographics
- Map and location infographics
- Flowchart infographics
- Process description infographics
Week 3
Week 4
Week 5
Exercise 1: Quantifiable Information
-
Quantify raw data and visualize information as a photograph
-
A is a visual representation of numerical data that allows for easy
interpretation and analysis.
Instruction:Gather a set of objects and separate it into category such as color, shape,
pattern, and other quantifiable factor.Example:1. Box of Lego2. Jar of button3. Jar of marble ball4. Set of colourful rubber strapIn this exercise you're required to quantify our chosen objects and arrange
them into a presentable layout or chart. The information must be presented as is, and you need to arrange the
objects with relevant indicators written out with pens to help you to
visualize the quantity and data. The examples of objects that can be use are
buttons, coins, lego pieces, M&Ms, and more.
Submission:
E-Portfolio report consists of
1. Photo of the random objects before sorting out
2. Objects sorted out by categories (2 - 5 category)
3. Write and design the information on a piece of papers.
Week 2:
This week we need to bring the materials we have prepared to the class and do
the exercises in class as well. Here I brought back pins, white paper and pens
from home.
Unsorted Data:
Fig.1.1 paper clip
Step 1 - Sorted
In order to bring order out of chaos, I first noticed that there were
several different colors of paper clips. So I sorted them into several
groups by color.
This step helped me visually categorize them into several groups, making it
easier for me to recognize potential combinations. The uniformity within
each color group laid the foundation for more detailed classification.
Fig.1.2 Sorted by color
Step 2 - ArrangedAfter sorting the colors in the simplest way,
since the sizes of the paper clips are all the same, I decided to make a
further classification based on the quantity of the paper clips.
Fig.1.3 Sorted by quantity
Step 3- Visual Structuring
I chose to make a Christmas tree because of the shape issue. The bent pins
standing upright look a bit like leaves. However, my green color is too
scarce, so I did a mix-and-match with it. Meanwhile, some of the paper clips
were twisted into circles and used as small decorations.
Fig.1.4 Visual Structuring
Final Quantify and Visualise data
Fig.1.5 christmas trees
Exercise 2: L.A.T.C.H INFOGRAPHIC POSTER
INSTRUCTION:
1. Organize a group of information into a visual poster that combines and
utilizes the LATCH principles (Minimum 4).
Location. Alphabet. Time. Category. Hierarchy.
2. You are required to use the digital photo editing/illustration software
available to assemble the information into a LATCH infographic poster.
3. You are allowed to reuse back the images but you have to create the rest
of visuals to complete the poster.
REQUIREMENTS:
1. Size resolution: A4 (100DPI)
2. Progress and submission link on E-Portfolio.
SUBMISSION:
1. Final poster attached to this submission.
2. E-Portfolio link attached to this submission.
Week 4:
Work Progress
I'm a very indecisive person. I've been choosing for a long time but still
don't know what to do. I have thought about creating a work by a singer I like
and a director I like, but I think it's not very easy to present.
Finally, I chose the Guangdong lion dance.
Introduction: The Guangdong Lion Dance features six main lion colors:
red, yellow, green, black, white, and gold. Each color represents a
famous hero from the Three Kingdoms era. These colorful lions perform
together to bring good luck and drive away evil spirits during
celebrations.
Simple facts about Guangdong lion dance:
Total number of lion dance: 6
Six lions of six colors: Yellow, Red, Green, Black, Blue, Gold
Location:
Machao Lion(Yellow)- GuangZhou
Liubei Lion(Red )- GuangZhou
Zhaoyun Lion(Green)- GuangZhou
Guanyu Lion (Black)- FoShan
Zhangfei Lion (Blue)- FoShan
Gold Lion - FoShan
Alphabet:
Gold Lion (Gold)
Guanyu Lion (Black)
Liubei Lion (Red)
Machao Lion (Yellow)
Zhangfei Lion(Blue)
Zhaoyun Lion (Green)
Time:
Guanyu Lion (Black)
Zhangfei Lion(Blue)
Liubei Lion (Red)
Zhaoyun Lion (Green)
Machao Lion (Yellow)
Gold Lion (Gold)
Category:
Leader Category - Liubei Lion (Red)
The category of loyalty and righteousness : Guanyu Lion
(Black)
Brave and valiant generals : Machao Lion (Yellow)、Zhangfei
Lion(Blue)、Zhaoyun Lion (Green)
Cultural symbol category :Gold Lion (Gold)
Hierarchy
Arranged in terms of the traditional importance of lions and their
representative figures in the Guangdong lion Dance culture:
Liubei Lion (Red) - Leadership core, a symbol of benevolence and
virtue
Guanyu Lion (Black) - Loyal, righteous and dignified, the core
guard
Zhangfei Lion(Blue) - Brave and fierce, valiant general
Zhaoyun Lion (Green) - Both intelligent and courageous, a valiant
pioneer
Machao Lion (Yellow) - Brave and heroic, a famous general of the
Eastern Han Dynasty
FoShan Gold Lion - Noble and Glorious
Then I found some pictures of information visualization on Pinterest to
provide myself with a little reference.
Fig. 2.1 reference
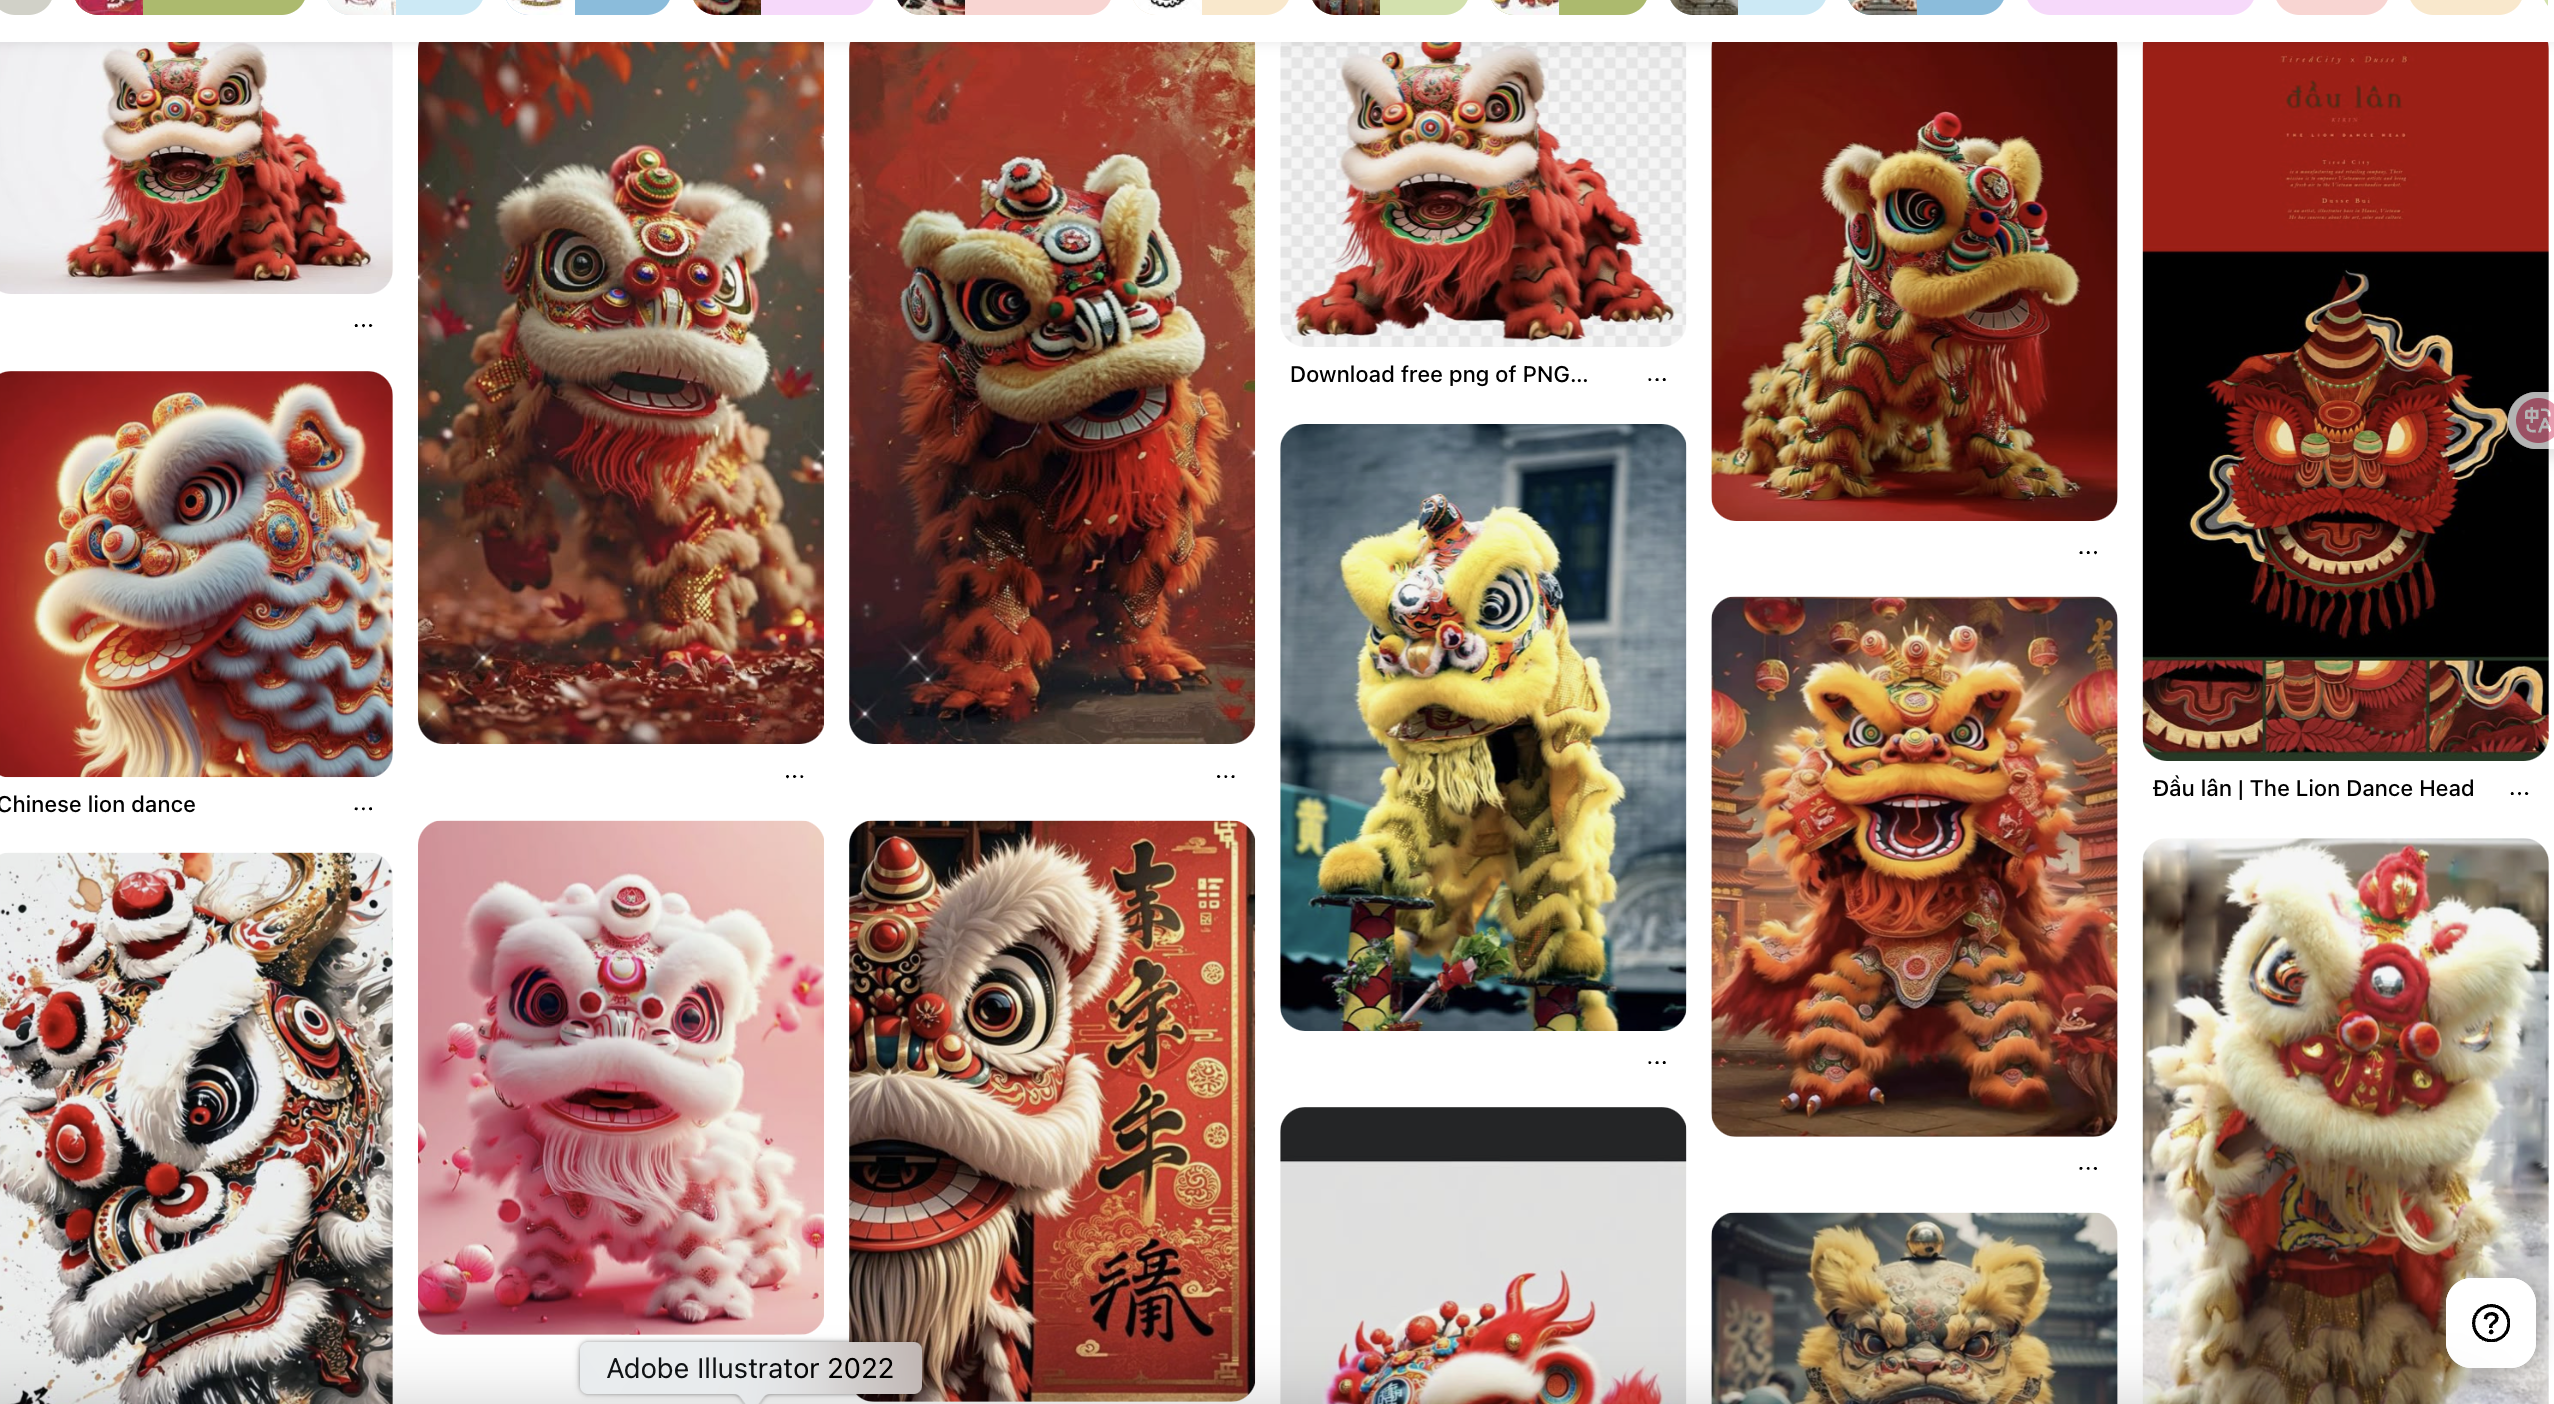
Meanwhile, I was looking for pictures of lion dancing on pinterest and
could see that they were all in red tones.
Fig. 2.2 lion dancing
Then I created an A4 file in ps as required. After I wanted to choose
the background, I built several frames to make it convenient for my
several lions to have a place to put them
Fig. 2.3 Process 1
Then I released a main lion. Then arrange these six lions in
alphabetical order, attempting to make it more harmonious.
Fig. 2.4 Process 2
Finally, I uninstalled some hierarchical information on this side and
then filled in a brief introduction.

Fig. 2.5 Process 3
The final presented effect.
Fig. 2.6 poster
REFLECTION
Exercise 1:
This is a very interesting task. We need to bring some items to the
class by ourselves and then try to classify them by size, color, or
quantity, etc. I chose the color and quantity, but Mr. Fauzi said my
quantity ranking was not quite right. I should have placed all of them
on one side or all on top. This way, the differences between the
quantities would be more intuitively displayed. However, since my paper
clip has been distorted, I haven't corrected the latest photo here.
Exercise 2:
Regarding Exercise 2, it's a bit difficult for me. I really have a hard
time choosing what to do. I think I can do anything, but what to do is
too difficult for me. The L.A.T.C.H principle is quite novel to me. It
turns out that information can be arranged in this way. This principle
can be applied to many things. And using it to make a poster is a very
interesting thing. You don't have to fill the entire poster. What's
important is to place the information properly. This has brought me many
insights.


Comments
Post a Comment